01 / Case study
Mentat Search
An SEO reporting platform that cannot misquote its own data
Problem
Managing SEO for dozens of client accounts at an agency means the same ritual every reporting cycle: open Search Console, grab clicks and impressions, open GA4, grab organic sessions and conversions, cross-reference, repeat per client. None of it is analysis. It is data collection, and it happens in browser tabs.
The same routine numbers then get restated in prose: the executive summary and performance highlights that open every client strategy document. Writing those by hand, thirty times, is templated work wearing an analyst’s clothes.
What I built
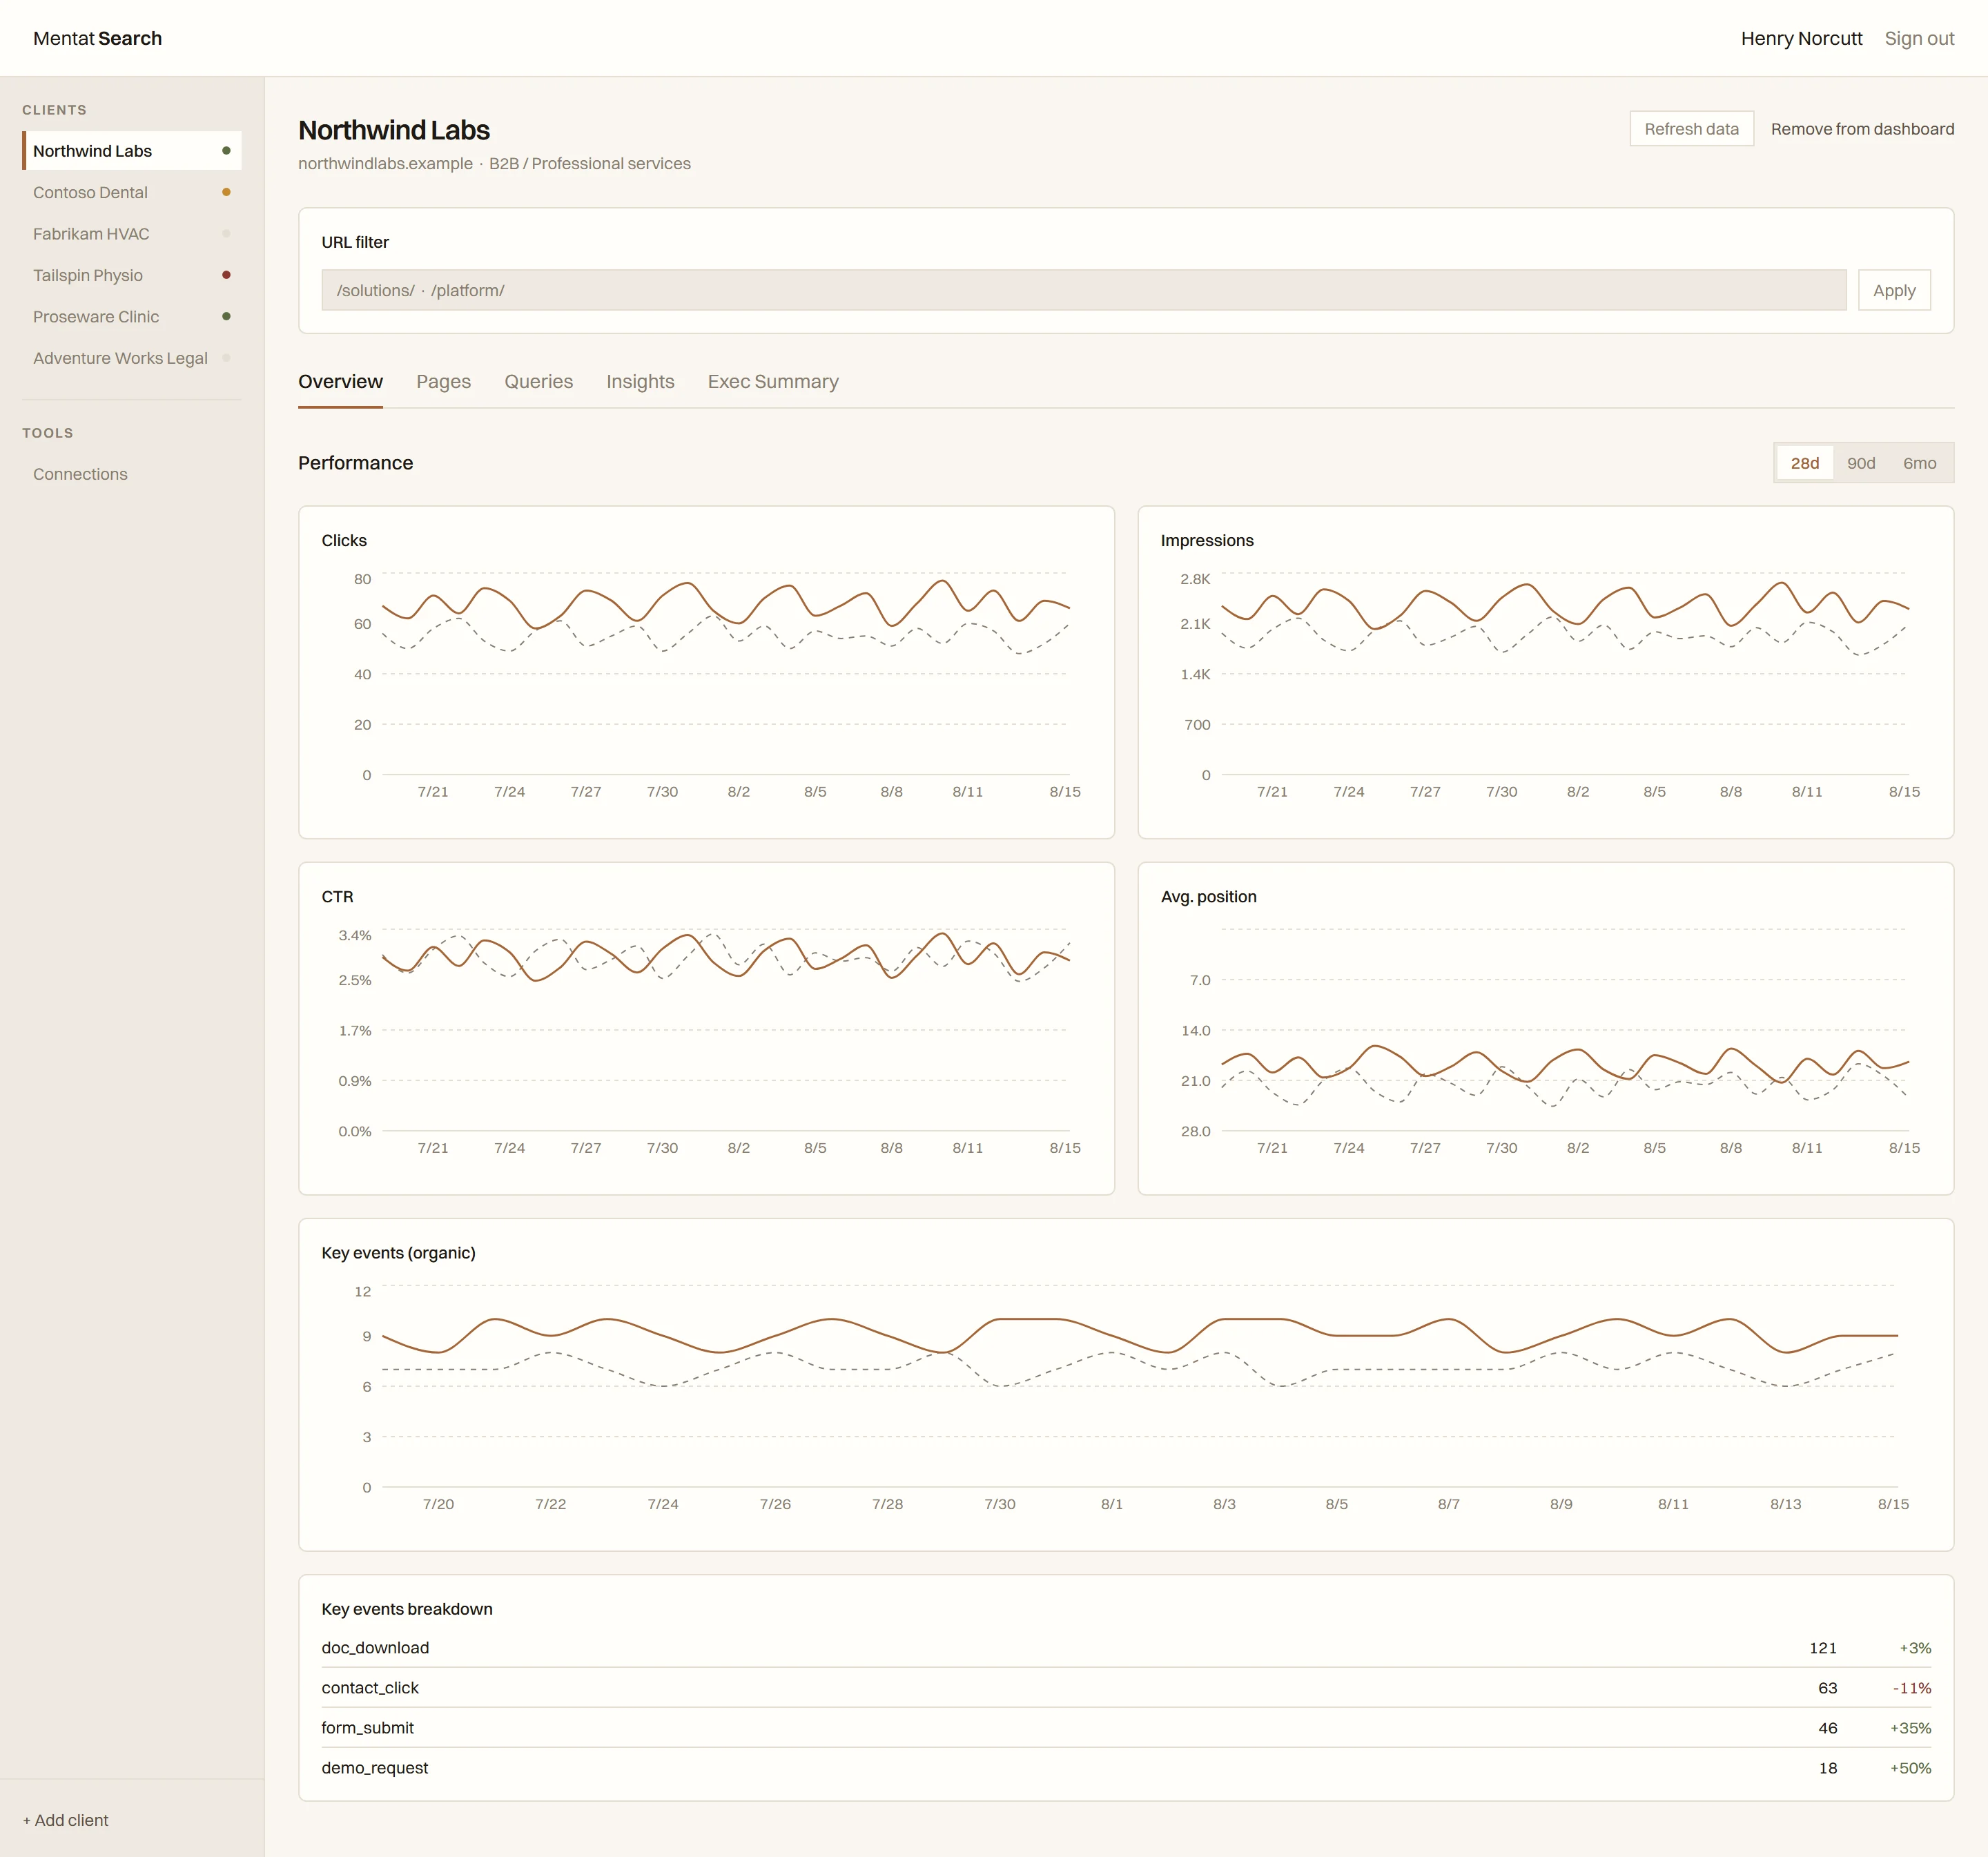
An internal reporting platform that put every routine data point in one place. One dashboard per client: Search Console and GA4 tabs side by side, organic-only and US-only filters matching how performance is actually reported, brand versus non-brand versus long-tail query categorization, sparkline trends, and sidebar health indicators across the whole account list so a problem account surfaces without opening it.
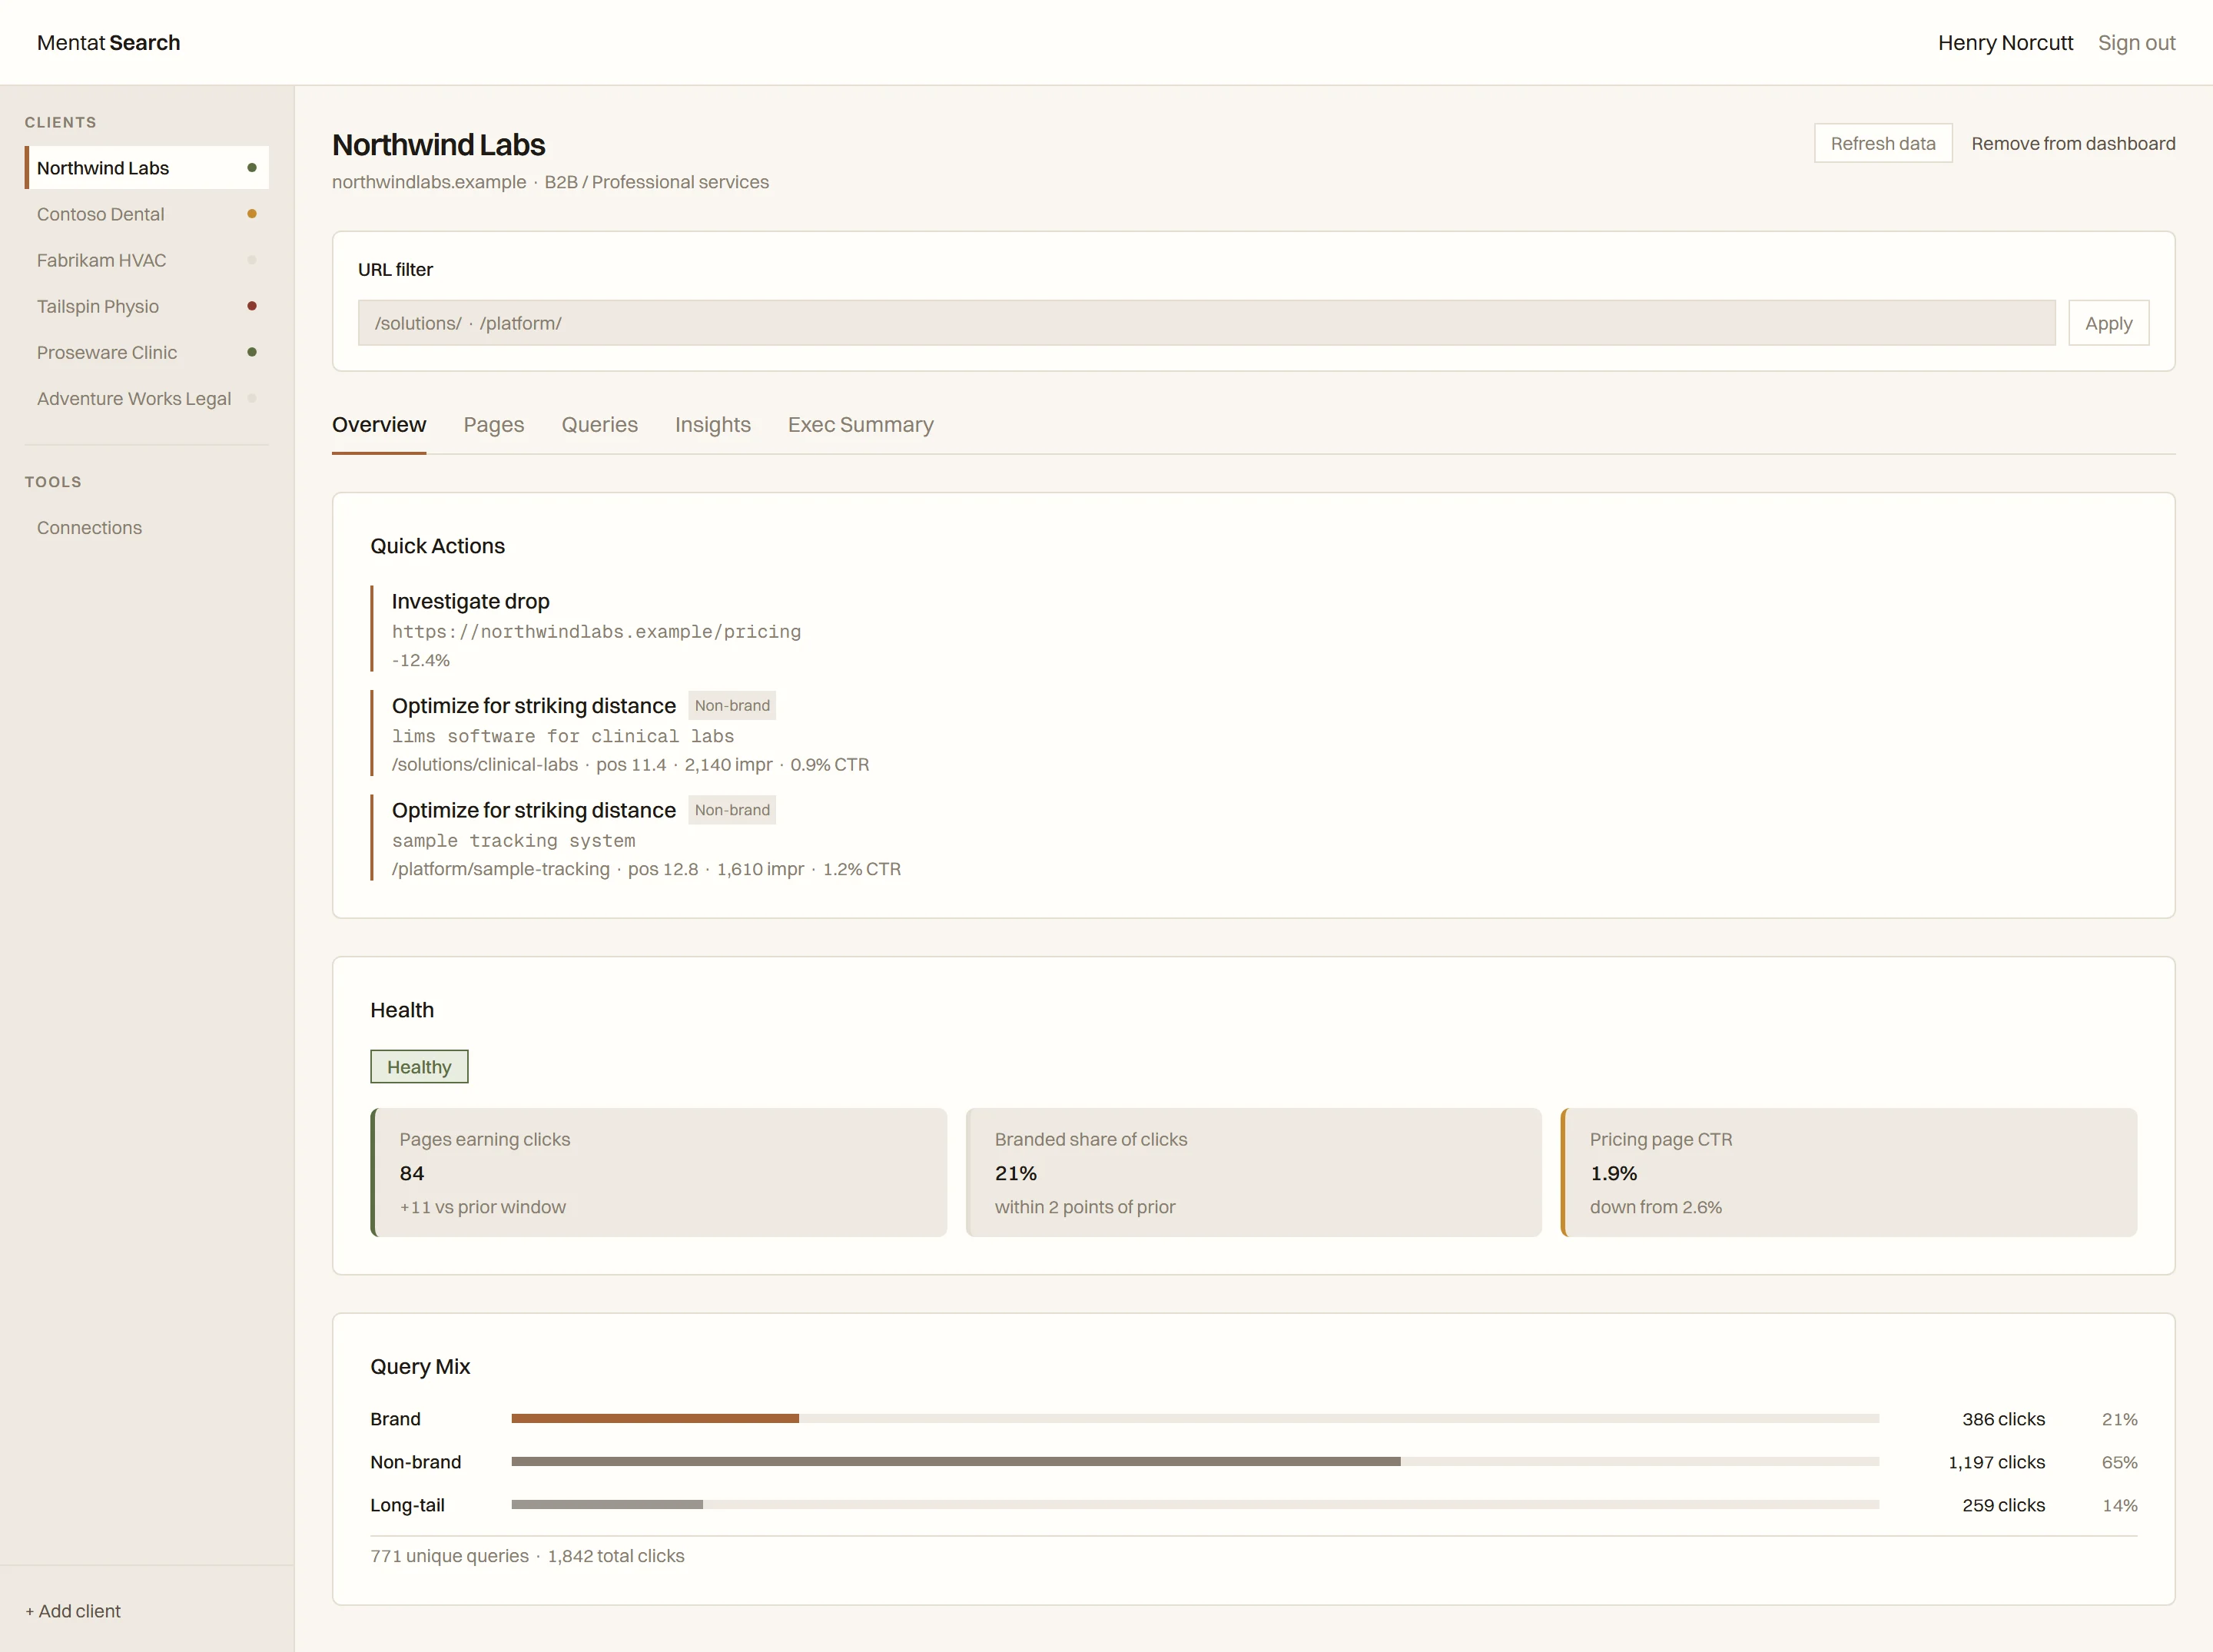
On top of the data layer: a one-click executive summary. The sections of a strategy document that restate the numbers, generated in seconds instead of written by hand.
How it works
The design rule that matters most: code computes every number, and the model is only allowed to write prose around figures it is handed. The AI never calculates, estimates, or recalls a metric. It structurally cannot state a wrong figure, which is the difference between an AI feature you can put in front of a client deliverable and one you have to audit line by line.
Northwind Labs — Organic Performance Summary
Organic search grew on every measure that matters this period. Impressions and clicks both rose faster than seasonal drift would explain, and average position improved by three spots, which is the change driving the click growth.
Computed in code
Impressions+29%
312,480from 241,905
Clicks+32%
9,614from 7,268
Average positionimproved 3.1 spots
16.8from 19.9
Click-through rateheld steady
3.1%from 3.0%
The second rule: every percent-change signal sits on top of an absolute volume floor. A page going from 4 clicks to 8 is not a 100 percent win worth reporting, and small accounts should not generate alarms that large-account math would. Thresholds are tuned to account size before anything gets flagged.
Data flows in from the Search Console and GA4 APIs on a per-client basis, is normalized and categorized in code, and renders as dashboards. The summary generator receives only the computed output.
Results and impact
It was my daily driver for a month across roughly 30 client accounts. The tab-bouncing stopped: every number I routinely pulled lived on one screen, and the executive summary sections that used to be hand-written restatements became a generation-and-review step.
Then I retired it, and that decision is part of the story. While using Mentat I was also building an agent-based SEO toolkit, and it became clear that agents which do the work outperform dashboards that display the work. A dashboard still ends with me reading numbers and acting. The agent architecture starts from the data and drafts the deliverable. I measured my own time, concluded the toolkit was the better bet, and moved my workflow onto it.
Mentat is the “make the data visible” phase. The toolkit, covered in its own case study, is the “make the work automatic” phase that replaced it. Building something useful, then recognizing when a better architecture has made it obsolete, is the loop this entire site is about: instrument the system, then let the numbers decide.